
改一行代码,到底要测多少功能?用调用链分析实现精准测试
本文来源: 测试开发小栈(公众号:测试开发小栈)
原文链接: https://mp.weixin.qq.com/s/xoZNJgMwW2HBEh3RJSC4wQ
发布时间: 2026-06-26 17:38

作者: 测试开发小栈 发布时间: 2026-06-26 17:38
测试工程师最怕的场景是什么?不是发现 bug,而是漏测。
你改了一个工具类里的方法,以为只影响 A 功能,上线后却发现 B 和 C 也崩了——因为这个方法被十几个地方悄悄调用着,而你根本不知道。传统的做法是"宁可多测、不可漏测",结果就是一个改动引发全项目回归,测试周期无限拉长。
有没有办法让测试更精准?java-callgraph2 提供了一种思路:通过对字节码的静态分析,把代码里真实的调用关系全部扒出来——从而精确回答"这个改动会影响到哪些方法、哪些接口、哪些链路"。
精准测试的第一步:搞清代码到底怎么跑的
java-callgraph2 是一款针对 编译后的 class / jar / war 的静态分析工具,基于 JVM 字节码指令解析,不需要运行代码,也不依赖源码。
核心能力:
- 完整调用链路:精准还原
Controller → Service → DAO → Mapper的每一跳 - Spring Bean & URL 映射:Controller 方法对应哪些接口路径
- 字段关联关系:
BeanUtils.copyProperties两端 DTO 字段的传导路径 - 注解提取:接口鉴权、数据校验等注解的路由目标
- 常量 & 变量类型解析:方法调用时传了什么值、用了什么类型
- Lambda & 动态代理追踪:invokeDynamic 指令解析,还原 Lambda 的真实调用目标
10 分钟快速上手
Step 1 · 构建工具
git clone https://github.com/Adrnministrator/java-callgraph2.git
cd java-callgraph2
./gradlew gen_run_jar
构建产物在 jar_output_dir/:
jar_output_dir/
├── jar/run_javacg2.jar       ← 主程序
├── lib/                      ← 依赖库
├── _javacg2_config/          ← 配置文件
├── _javacg2_parse_*.av       ← 过滤规则
├── gen_callgraph_dot.py      ← 调用图生成脚本
└── run.bat / run.sh          ← 启动脚本
Step 2 · 编译目标项目
java-callgraph2 分析的是编译后的 class 文件,不是源码。先编译目标项目。
# Maven 项目
cd <目标项目>
mvn compile -DskipTests

# Gradle 项目
gradlew compileJava编译产物目录:target/classes/(Maven)或 build/classes/(Gradle)。
Step 3 · 配置分析目标
编辑 jar_output_dir/_javacg2_config/jar_dir.properties,每行指定一个路径:
# 支持目录
<目标项目>/target/classes

# 也支持直接指定 jar / war
<目标项目>/target/easy-admin.war
Step 4 · 过滤第三方代码 ⚠️
不配置过滤的话,Spring、Hutool、MyBatis 等第三方库会被全部解析,输出量大且干扰严重。
文件 1:parse_ignore_class.av — 跳过解析第三方类
string.startsWithAny(package_name, 'java.', 'javax.', 'org.springframework.',
    'org.apache.', 'org.slf4j.', 'cn.hutool.', 'com.alibaba.', 'com.baomidou.',
    'io.swagger.', 'springfox.', 'redis.clients.', 'com.mysql.', 'org.mybatis.',
    'com.github.pagehelper.', 'net.minidev.', 'org.bouncycastle.', 'com.google.',
    'com.fasterxml.', 'org.hibernate.')
文件 2:parse_ignore_method_call.av — 跳过解析第三方方法调用
string.startsWithAny(ee_package_name, 'java.', 'javax.', 'org.springframework.',
    'org.apache.', 'org.slf4j', 'cn.hutool', 'com.alibaba', 'com.baomidou',
    'io.swagger', 'springfox', 'redis.clients', 'com.mysql', 'org.mybatis',
    'com.github.pagehelper', 'net.minidev', 'org.bouncycastle', 'com.google',
    'de.codecraftsr', 'com.fasterxml', 'org.hibernate', 'java.lang.invoke')
根据目标项目依赖自行增删包名前缀。过滤后 method_call 从 6793 行降到 2291 行,只保留业务代码的调用关系。
Step 5 · 运行分析
cd <java-callgraph2>/jar_output_dir
run.bat   # Windows
# 或
./run.sh  # Linux / Mac
输出目录:
<目标项目>/target/classes/classes-javacg2_merged.jar-output_javacg2/精准测试的核心武器:method_call.txt
这个文件是整个工具的灵魂,格式如下:
序号  调用类型   调用方完整方法签名                    被调用方完整方法签名                    代码行号
1     VIR       com.xxx.controller.UserCtrl:getById  com.xxx.service.UserService:getById  15
2     SPE       com.xxx.service.UserService:getById  com.xxx.mapper.UserMapper:selectById  28
结合过滤后的业务代码数据,你可以快速回答这些问题:
- 某个 Service 被多少个方法调用过? → 直接 grep 搜索被调用方
- 改了一个工具类,想知道会影响哪些上层方法? → 反向追溯所有调用者
- 某个 Controller 接口,背后涉及哪些 Bean? → 顺向追踪完整链路
调用类型说明
| 类型 | 含义 |
|---|---|
| VIR | 普通方法调用(invokevirtual) |
| SPE | 构造器 / super 调用(invokespecial) |
| STA | 静态方法调用(invokestatic) |
| _SPR_ACT_C | Spring Bean 调用,替换为实际子类 |
| _ACT_I | 接口调用替换为实现类 |
| _CCS_SPE | 子类调用 super.xxx |
| _RIR1/_RIR2 | Runnable → run() |
| _TSR | Thread.start() → run() |
| _LM | Lambda 表达式 |
| _MAA | 通过注解自动添加的调用关系 |
可视化:生成调用链路图
Python 脚本一键从 method_call.txt 生成 Graphviz DOT 文件,浏览器直接渲染。
按类名追踪完整调用链
cd <输出目录>

# 默认深度 2:直接调用者 + 被调用者
python gen_callgraph_dot.py method_call.txt StompMessageService

# 深度 3:覆盖两级间接调用
python gen_callgraph_dot.py method_call.txt StompMessageService 3
深度参考:
| 深度 | 覆盖范围 | 适合场景 |
|---|---|---|
| 1 | 直接上下游 | 单层快速确认 |
| 2 | 两级间接调用 | 日常精准测试 |
| 3~5 | 完整调用链 | 深度追踪核心类 |
节点颜色含义:
- 🟠 橙色 — 目标类自身
- 🟢 绿色 — Controller 层
- 🔴 红色 — Service / DAO / Mapper 层
- 🔵 蓝色 — 其他类
查看 DOT 图
将 .dot 文件内容粘贴到 https://utilitykit.tools/graphviz-renderer 即可渲染。
精准测试实战:用调用链确定回归范围
这是这个工具对测试工程师最有价值的地方——结合代码改动,定量确定需要回归的接口和方法。
工作流程
① 抓取两个版本的代码 diff(git diff / diff 命令)
      ↓
② 从 method_call.txt 中筛选出受影响的方法列表
      ↓
③ 从 method_annotation.txt 查找对应的路由注解(STOMP 用 @MessageMapping)
      ↓
④ 生成精准回归用例清单
示例:追踪 StompMessageService:sendMessage
以真实测试项目为例,分析 StompMessageService:sendMessage() 方法的上下游调用关系:
cd <输出目录>

# 查出所有调用过 sendMessage 的方法(调用方)
grep "StompMessageService:sendMessage" method_call.txt
输出:
999   VIR   EasyWebSocketEventListener:handleDisconnectListener    StompMessageService:sendMessage    63
1005  VIR   EasyWebSocketEventListener:lambda$handleConnectListener$0    StompMessageService:sendMessage    43
1200  VIR   WebSocketCharConroller:chatRoom    StompMessageService:sendMessage    26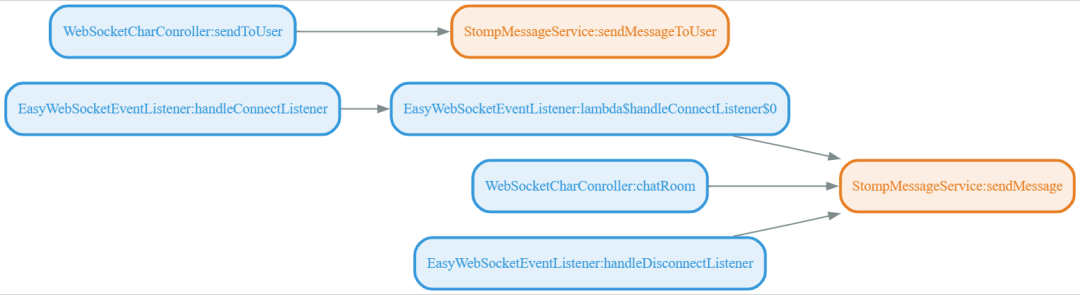
可见修改 sendMessage 后,至少需要回归 3 个入口:
| 入口 | 说明 |
|---|---|
| STOMP /chatRoom | WebSocketCharConroller:chatRoom → sendMessage |
| 连接建立时 | EasyWebSocketEventListener:lambda$handleConnectListener$0 → sendMessage |
| 连接断开时 | EasyWebSocketEventListener:handleDisconnectListener → sendMessage |
再配合 method_annotation.txt 可以直接拿到 STOMP 路由注解:
grep "WebSocketCharConroller" method_annotation.txtWebSocketCharConroller:chatRoom @MessageMapping value={/chatRoom}
WebSocketCharConroller:sendToUser @MessageMapping value={/chat}反向追溯:改了底层方法影响哪些上层?
# 查出 sendMessageToUser 调用了哪些下游方法(被调用方)
grep "StompMessageService:sendMessageToUser" method_call.txt
完整回归清单生成思路
将 method_call.txt + method_annotation.txt + extends_impl.txt 等输出文件联合分析,可以构建一张从接口到数据库操作的完整链路图,从而:
- 正向影响分析:改 A 方法 → 影响哪些接口 → 生成用例
- 反向污染分析:改公共组件 → 哪些业务接口被污染 → 评估回归范围
- Bean 依赖分析:
spring_bean.txt追踪 Spring 容器初始化链路,避免漏测 Bean 注入问题 - 字段传导分析:修改 DTO 字段时,
analyse.field.relationship=true可追踪字段在 copyProperties 中的流向
高级配置
编辑 jar_output_dir/_javacg2_config/config.properties:
# 输出文件格式
output.file.ext=.md

# 自定义输出目录
output.root.path=/callgraph-output

# 解析方法调用参数类型与值(推荐开启)
parse.method.call.type.value=true

# 解析 DTO 字段关联关系
analyse.field.relationship=true

# 遇到解析错误继续执行
continue.when.error=true
配合大模型做代码分析
项目支持对接大模型做深度代码分析:
- DeepWiki:https://deepwiki.com/Adrnministrator/java-callgraph2(无需注册)
- zread.ai:https://zread.ai/Adrnministrator/java-callgraph2
将调用链数据喂给 AI,可以让它基于完整的代码关系图谱分析改动影响面,比直接扔源码要准确得多。
如需更深入的数据库分析和 Web 可视化,可以使用配套项目 java-all-call-graph(含 Web 界面 + MCP 版本)。
总结
java-callgraph2 对测试工程师的价值,在于把"凭经验判断"变成"凭数据说话":
- ✅ 精准划定回归范围:调用链数据说话,不靠猜
- ✅ 发现隐藏调用路径:跨模块、跨层的间接调用一览无余
- ✅ 接口覆盖不遗漏:Controller → Bean → Service → DAO 链路完整还原
- ✅ DTO 字段传导追踪:修改公共 DTO 时心里有数
- ✅ 零运行时依赖:纯静态分析,随时可用,不需要启动服务
每次代码变更前花 5 分钟跑一次调用链分析,测试用例的覆盖率会提升一个档次,漏测风险大幅下降。精准测试,从搞清楚代码的真实流向开始。
附:调用图生成脚本源码
脚本位于 jar_output_dir/gen_callgraph_dot.py,核心逻辑基于 BFS 纯链追踪——只保留 target→caller→caller(上游的上游)和 target→callee→callee(下游的下游),不混入交叉路径,保证调用链清晰可读。
"""从 java-callgraph2 的 method_call.txt 生成 Graphviz DOT 调用图

用法:
  python gen_callgraph_dot.py method_call.txt [类名] [最大深度]

- 不指定类名: 生成全项目调用图
- 指定类名: BFS递归追踪该类所有上下游调用链路(默认深度2)
- 指定深度: 第三个参数控制最大递归深度

说明:
  只保留上游的上游(target→caller→caller)和下游的下游(target→callee→callee),
  不保留交叉路径(target→caller→callee或target→callee→caller)

示例:
  python gen_callgraph_dot.py method_call.txt StompMessageService
  python gen_callgraph_dot.py method_call.txt StompMessageService 3
"""
import sys
import os


def parse_method_call(filepath):
    """Return edges list and two lookup indices: caller->callees, callee->callers"""
    edges = []
    caller_to_callees = {}
    callee_to_callers = {}
    with open(filepath, 'r', encoding='utf-8') as f:
        for line in f:
            parts = line.strip().split('\t')
            if len(parts) < 4:
                continue
            caller = parts[2]
            callee = parts[3]
            # Strip call type prefix like (VIR) (SPE) etc.
            if callee.startswith('('):
                paren_end = callee.find(')')
                if paren_end != -1:
                    callee = callee[paren_end + 1:]
            edges.append((caller, callee))
            caller_to_callees.setdefault(caller, []).append(callee)
            callee_to_callers.setdefault(callee, []).append(caller)
    return edges, caller_to_callees, callee_to_callers


def extract_class_method(full_method):
    colon_pos = full_method.rfind(':')
    if colon_pos == -1:
        return full_method, full_method
    class_part = full_method[:colon_pos]
    method_part = full_method[colon_pos + 1:]
    paren_pos = method_part.find('(')
    if paren_pos != -1:
        method_name = method_part[:paren_pos]
    else:
        method_name = method_part
    short_class = class_part.rsplit('.', 1)[-1]
    return class_part, f"{short_class}:{method_name}"


def bfs_upstream_only(seed_methods, callee_to_callers, max_depth):
    """Only go upstream: find callers of callers (ancestors of ancestors)"""
    visited = set(seed_methods)
    queue = list(seed_methods)
    result_edges = set()
    while queue:
        method = queue.pop(0)
        for caller in callee_to_callers.get(method, []):
            result_edges.add((caller, method))
            if caller not in visited:
                visited.add(caller)
                queue.append(caller)
    return result_edges


def bfs_downstream_only(seed_methods, caller_to_callees, max_depth):
    """Only go downstream: find callees of callees (descendants of descendants)"""
    visited = set(seed_methods)
    queue = list(seed_methods)
    result_edges = set()
    while queue:
        method = queue.pop(0)
        for callee in caller_to_callees.get(method, []):
            result_edges.add((method, callee))
            if callee not in visited:
                visited.add(callee)
                queue.append(callee)
    return result_edges


def bfs_trace(seed_class, caller_to_callees, callee_to_callers, max_depth):
    """BFS from seed_class: find both upstream and downstream in pure chains"""
    visited = set()
    queue = []

    # Seed: find all methods of the target class
    for method in set(caller_to_callees.keys()) | set(callee_to_callers.keys()):
        class_part, _ = extract_class_method(method)
        if seed_class in class_part:
            if method not in visited:
                visited.add(method)
                queue.append(method)

    if not queue:
        print(f"Warning: No methods found for class '{seed_class}'")
        return []

    # Separate BFS for upstream and downstream
    upstream_edges = bfs_upstream_only(queue, callee_to_callers, max_depth)
    downstream_edges = bfs_downstream_only(queue, caller_to_callees, max_depth)

    return list(upstream_edges | downstream_edges)


def generate_dot(edges, output_path, seed_class):
    seed_class = seed_class or ''
    controller_color = ('#2ecc71', '#2ecc7122')
    service_color = ('#e74c3c', '#e74c3c22')
    seed_color = ('#e67e22', '#e67e2222')  # orange for seed class
    default_color = ('#3498db', '#3498db22')

    nodes = {}
    for caller, callee in edges:
        for method in (caller, callee):
            if method not in nodes:
                class_part, label = extract_class_method(method)
                if seed_class in class_part:
                    color = seed_color
                elif 'controller' in class_part.lower():
                    color = controller_color
                elif any(k in class_part.lower() for k in ('service', 'dao', 'mapper', 'repository')):
                    color = service_color
                else:
                    color = default_color
                nodes[method] = (label, class_part, color)

    with open(output_path, 'w', encoding='utf-8') as f:
        f.write('digraph callgraph {\n')
        f.write('  rankdir=LR;\n')
        f.write('  node [shape=box, fontsize=10, style="filled,rounded", penwidth=1.5];\n')
        f.write('  edge [color="#7f8c8d", arrowsize=0.7];\n')

        for method, (label, class_part, (stroke, fill)) in nodes.items():
            f.write(f'  "{method}" [label="{label}", color="{stroke}", '
                    f'fillcolor="{fill}", fontcolor="{stroke}", penwidth=2.0];\n')

        for caller, callee in edges:
            f.write(f'  "{caller}" -> "{callee}";\n')

        f.write('}\n')

    print(f"Generated: {output_path} ({len(nodes)} nodes, {len(edges)} edges)")


def main():
    if len(sys.argv) < 2:
        print(__doc__)
        sys.exit(1)

    method_call_file = sys.argv[1]
    target_class = sys.argv[2] if len(sys.argv) > 2 else None
    max_depth = int(sys.argv[3]) if len(sys.argv) > 3 else 2

    if not os.path.exists(method_call_file):
        print(f"File not found: {method_call_file}")
        sys.exit(1)

    edges, caller_to_callees, callee_to_callers = parse_method_call(method_call_file)

    if target_class:
        edges = bfs_trace(target_class, caller_to_callees, callee_to_callers, max_depth)
        output_name = f"{target_class}_callgraph.dot"
        print(f"Pure chain trace for '{target_class}' (max_depth={max_depth})")
    else:
        output_name = "project_callgraph.dot"

    output_path = os.path.join(os.path.dirname(os.path.abspath(method_call_file)), output_name)
    generate_dot(edges, output_path, target_class)


if __name__ == '__main__':
    main()
相关链接:
- 工具项目:https://github.com/Adrnministrator/java-callgraph2
- 测试项目(easy-admin):https://gitee.com/lakernote/easy-admin
- 深度分析配套:https://github.com/Adrnministrator/java-all-call-graph
- Web + MCP 版本:https://github.com/Adrnministrator/java-all-call-graph-server
本文转载自微信公众号「测试开发小栈」,仅供学习交流使用。
觉得内容不错?我要